Command Line Interface
d3rlpy provides the convenient CLI tool.
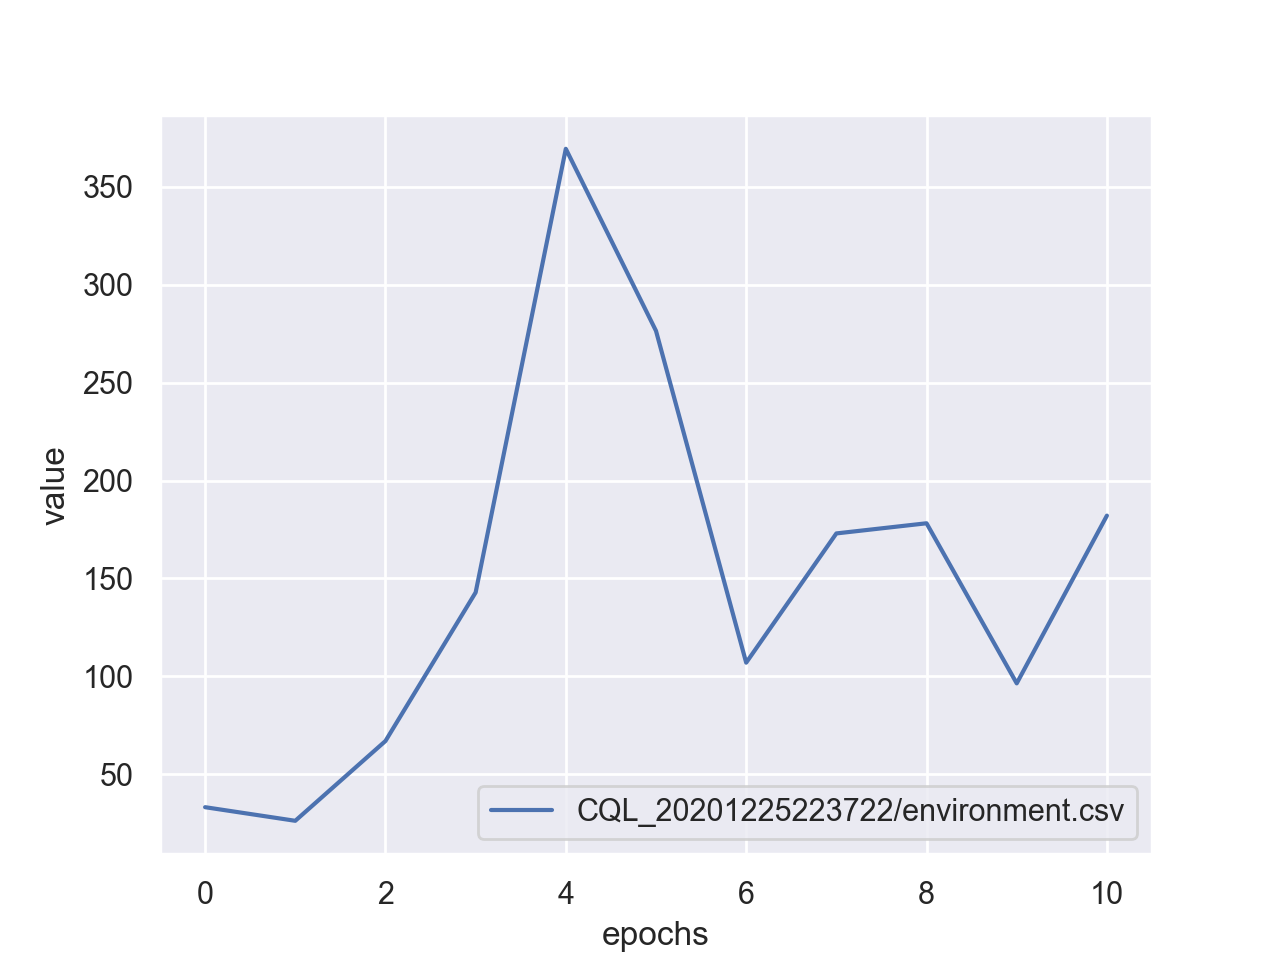
plot
Plot the saved metrics by specifying paths:
$ d3rlpy plot <path> [<path>...]
option |
description |
|---|---|
|
moving average window. |
|
use iterations on x-axis. |
|
show maximum value. |
example:
$ d3rlpy plot d3rlpy_logs/CQL_20201224224314/environment.csv
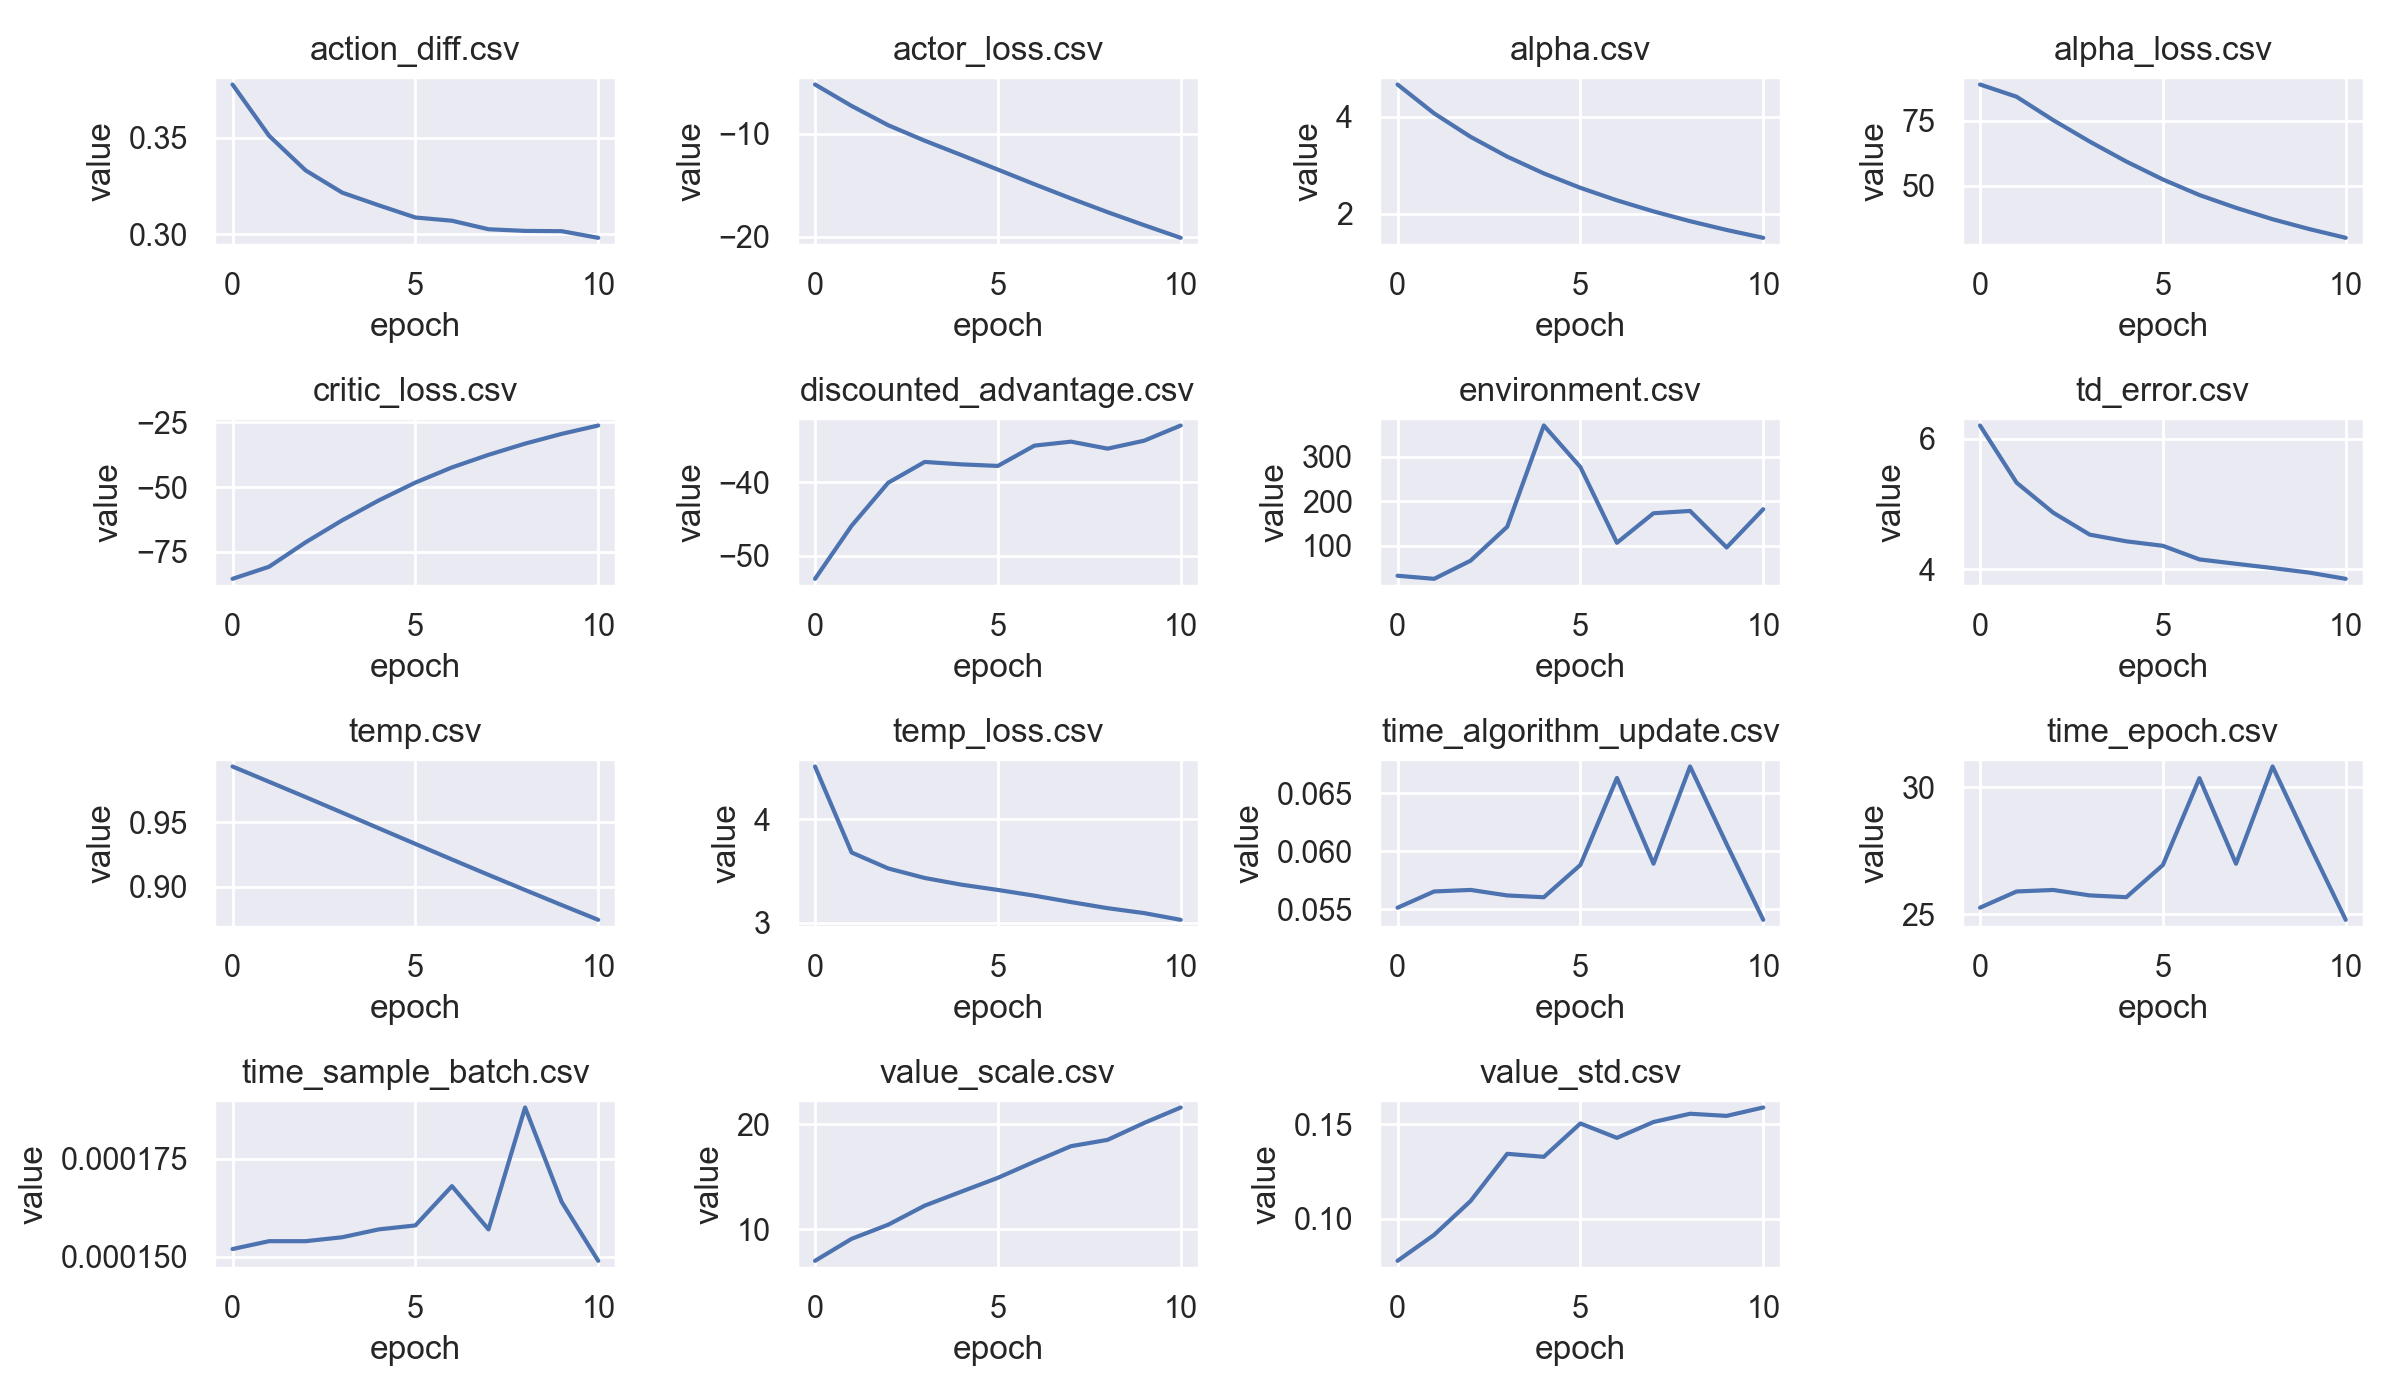
plot-all
Plot the all metrics saved in the directory:
$ d3rlpy plot-all <path>
example:
$ d3rlpy plot-all d3rlpy_logs/CQL_20201224224314
export
Export the saved model to the inference format, onnx and torchscript:
$ d3rlpy export <path>
option |
description |
|---|---|
|
model format (torchscript, onnx). |
|
explicitly specify params.json. |
|
output path. |
example:
$ d3rlpy export d3rlpy_logs/CQL_20201224224314/model_100.pt